


This website uses cookies so that we can provide you with the best user experience possible. Cookie information is stored in your browser and performs functions such as recognising you when you return to our website and helping our team to understand which sections of the website you find most interesting and useful.
home /
Small Business Lending
Small Business Health Index – Q1 2022 Update
23 Mar 2022
Highlights
- Among Ocrolus clients signed before 2021, application volume has increased by 28% over the last two years from December 2019 to December 2021.
- Across Ocrolus customers, which span many different industries, small businesses are sitting on average daily balances almost 80% greater than 2019 levels
- Labor-intensive and services-based industries such as furniture manufacturing, amusement, and gambling & recreation have been among the top document indexing small business sectors in recent months, driven in large part by robust job growth.
- Geographically, Texas and Arizona have joined Utah and Idaho as the only U.S. states that have recovered all the jobs they lost at the start of the pandemic. This regrowth, driven by population growth, relaxed Covid-19 restrictions, and outsize payroll growth, has led to high index scores in the major cities of those areas while cities in California and the Northeast lag behind and have yet to match their index scores pre-pandemic.
Overall Small Business Health Trends
While the pandemic resulted in shuttered businesses and ruined personal finances, for many, the opposite happened. Shutdowns and unemployment reaching levels not seen since the Great Depression were met with trillions of dollars in government stimulus and the economy’s swift recovery. According to the Census Bureau, the first two rounds of stimulus payments lifted 11.7 million people out of poverty, leaving Americans with $2.7 trillion in extra savings built up. The personal savings rate hit a record high of 33.8% in April 2020, according to the Bureau of Economic Analysis, up from an average of under 8% for the two years prior to the pandemic began.
Ocrolus bank account data confirms the new level of financial security for many businesses and families. The following graph shows average daily balances trends for small businesses in a select group of industries at the time of the loan application.
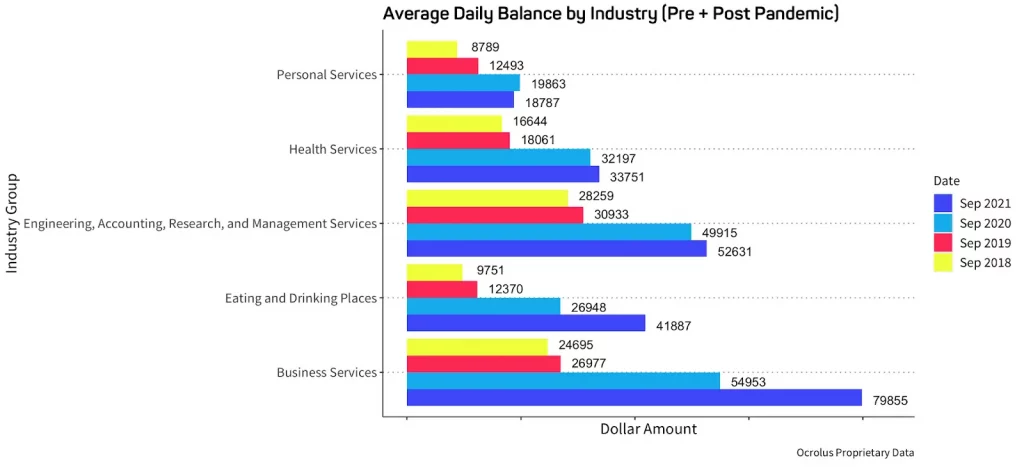
Across several industries, the average daily balance of business bank accounts have grown since the start of the pandemic, as businesses and consumers alike saved and built up cash buffers to deal with further unexpected events. Rising cash balances across industries have been driven by a combination of the widespread government support for small businesses via commercial and fintech banks and cash flow from operations (notwithstanding the latest slowdown in average revenues from the breakout of the Omicron variant).
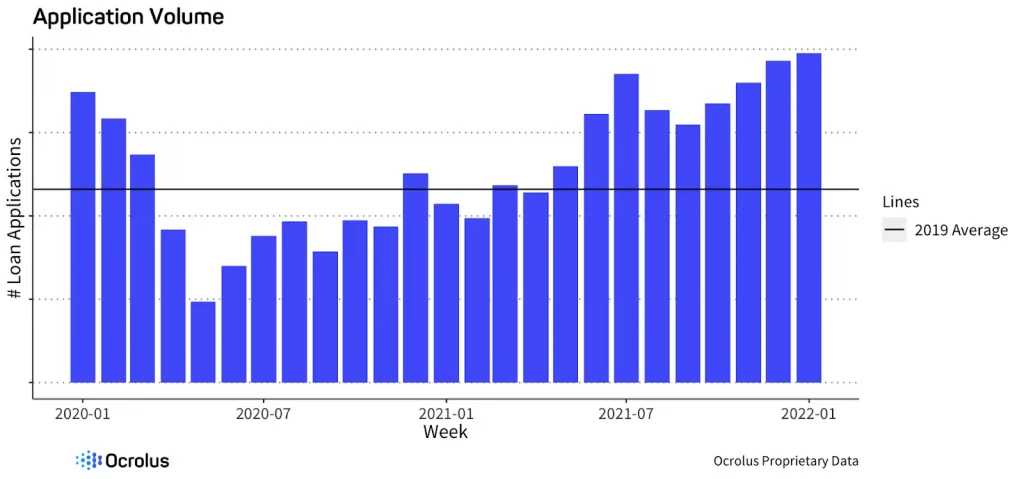
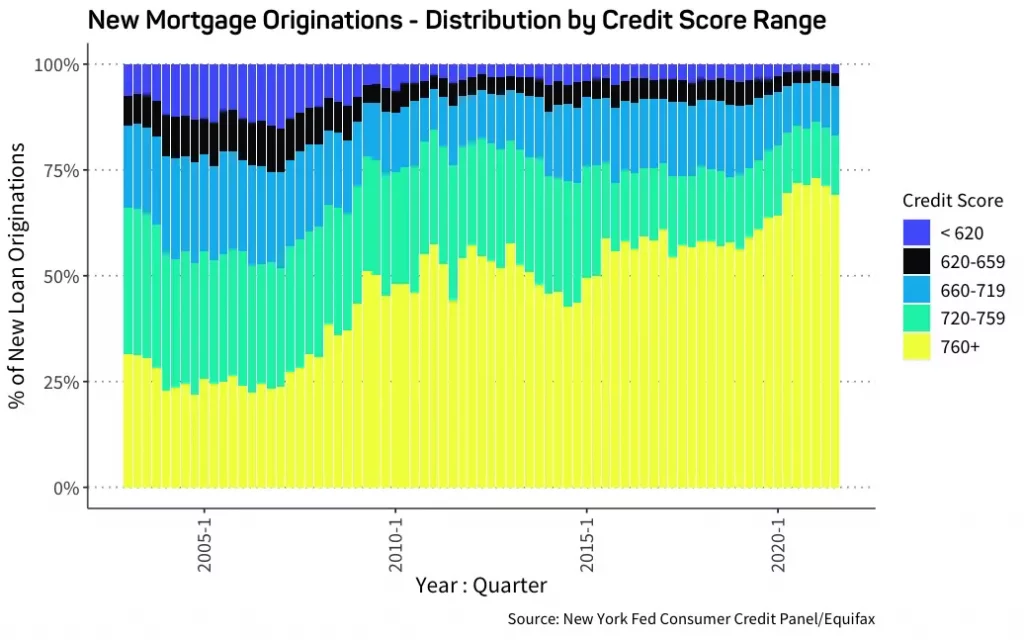
Applications for small business credit through Ocrolus-enabled lenders have grown to levels that are now above those seen since before the pandemic. Even as the appetite for credit has increased, the average borrower profile has shifted dramatically for those looking to take on new credit, with average credit scores rising to new highs (as measured by FICO).
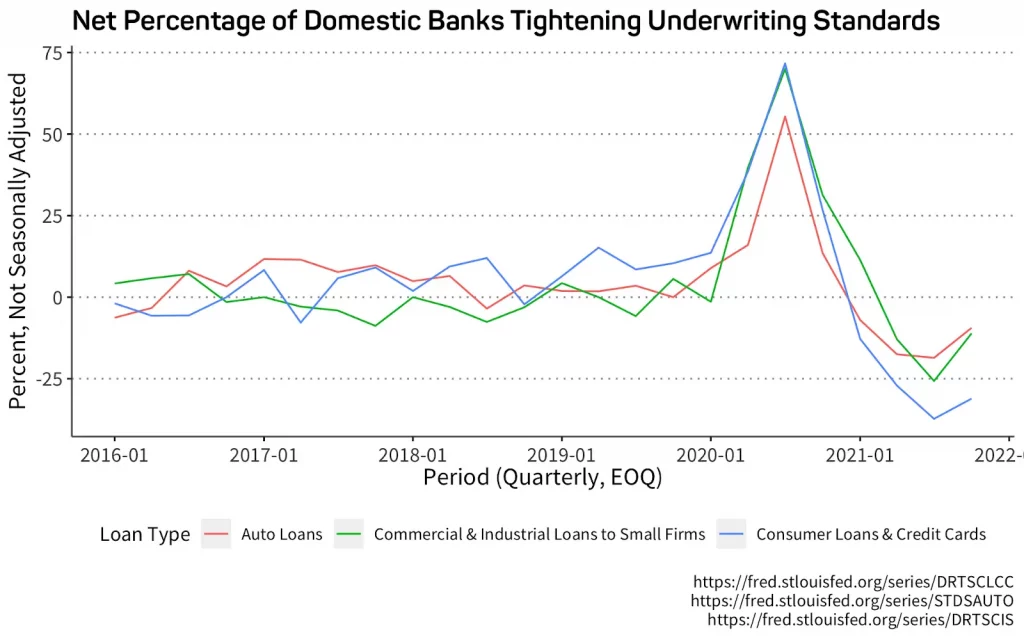
Banks are taking notice of improved credit quality. Over the past quarter, bank standards have eased, in direct contrast to the early months of the pandemic when lenders tightened loan approval standards in preparation for a large influx of missed payments. With government stimulus and expanded unemployment payments keeping defaults at bay, some 33% of banks reported easing their credit standards in the months preceding October, according to the latest Federal Reserve senior loan officer survey, compared to only 4% a year earlier. This loosening of bank standards, combined with robust bank balances for individuals and small businesses, is a vote of confidence in the health of the U.S. economy and Americans’ finances.
SBHI Sector Summary
The SBHI sector data shows the impact the recent surge of Omicron cases has had on the momentum of the labor market and broader economy in the service sector. Initial unemployment claims had dipped below the 2019 average during the Fall, only to reverse course in early January.
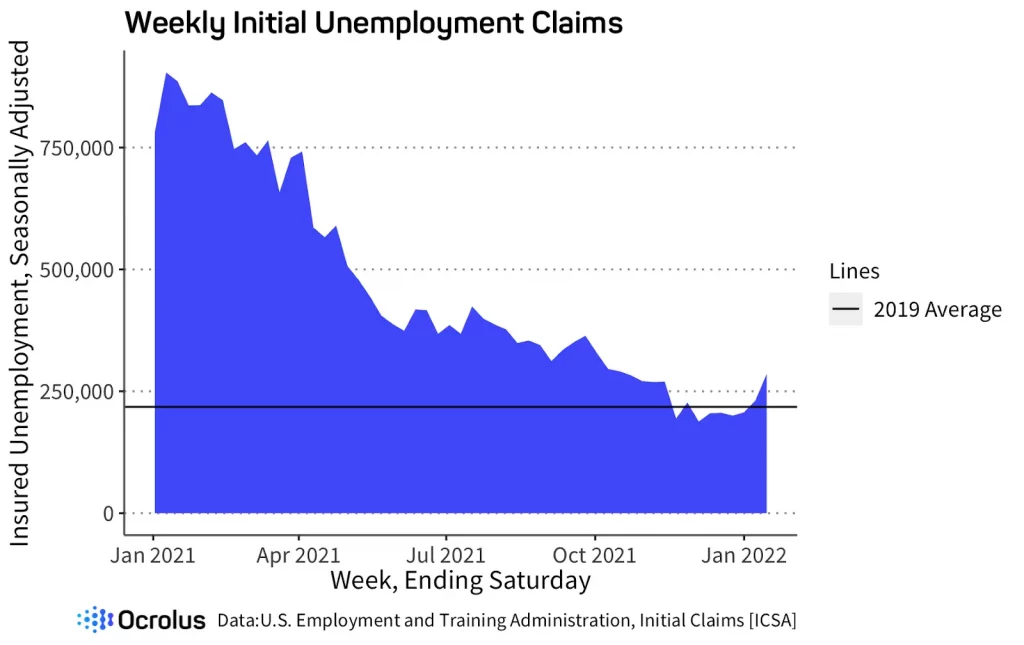
Driving these numbers are the almost 8.8 million adults in the U.S. in early January who were unable to work due to personal or family illness associated with Covid-19, according to a Census Bureau survey. This is by far the highest figure in the “household pulse” survey, exceeding the 6.6 million recorded last January.
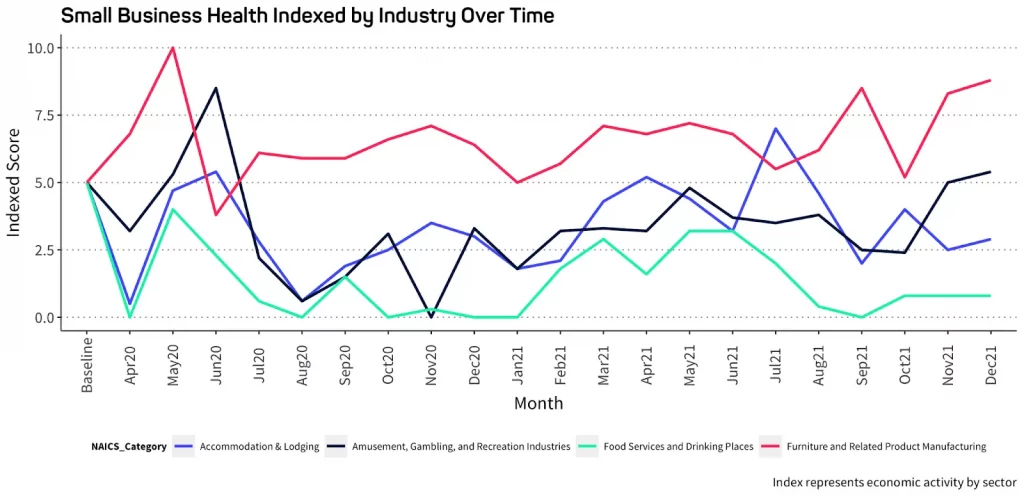
The Ocrolus SBHI provides a real-time snapshot of the state of small business activity in the U.S. The Index and these small business statistics provide a window into the resilience and prospect for recovery for millions of businesses by aggregating a combination of highly relevant external data with proprietary Ocrolus insights at the borrower level. The graph below provides Index scores for a select group of industries.
| Small Business Health Indexed by Industry | ||
| Industry Type | SBH Score | Change |
| Food Services and Drinking Places | 0.8 | flat |
| Amusement, Gambling, and Recreation Industries | 5.4 | +0.4 pts |
| Accommodation & Lodging | 2.9 | +0.4 pts |
| Furniture and Related Product Manufacturing | 8.8 | +0.5 pts |
SBHI Geographic Summary
Economically, the hottest section of the country is the South, where new residents moved from other parts of the country, and local governments loosened pandemic-related business restrictions. In the third quarter alone, wages and salaries in the South grew faster than in any other region
The graph below provides Index scores for a select group of metropolitan statistical areas (MSAs).
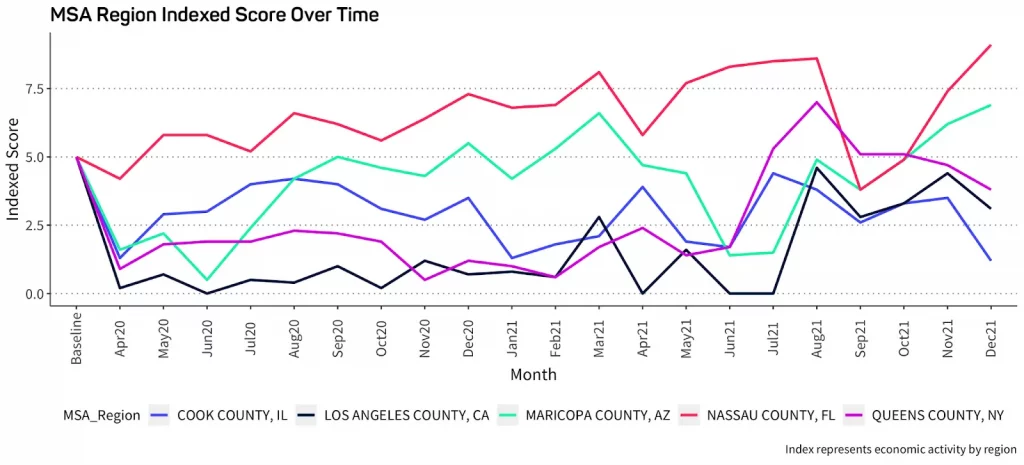
| MSA Index | ||
| County | SBR Score | Change |
| Los Angeles County, CA | 3.1 | -1.3 pts |
| Nassau County, FL | 9.1 | +1.7 pts |
| Cook County, IL | 1.2 | -2.3 pts |
| Maricopa, AZ | 6.9 | +0.7 pts |
| Queens County, NY | 3.8 | -0.9 pts |
Other External Features Explaining the State of Small Business Credit
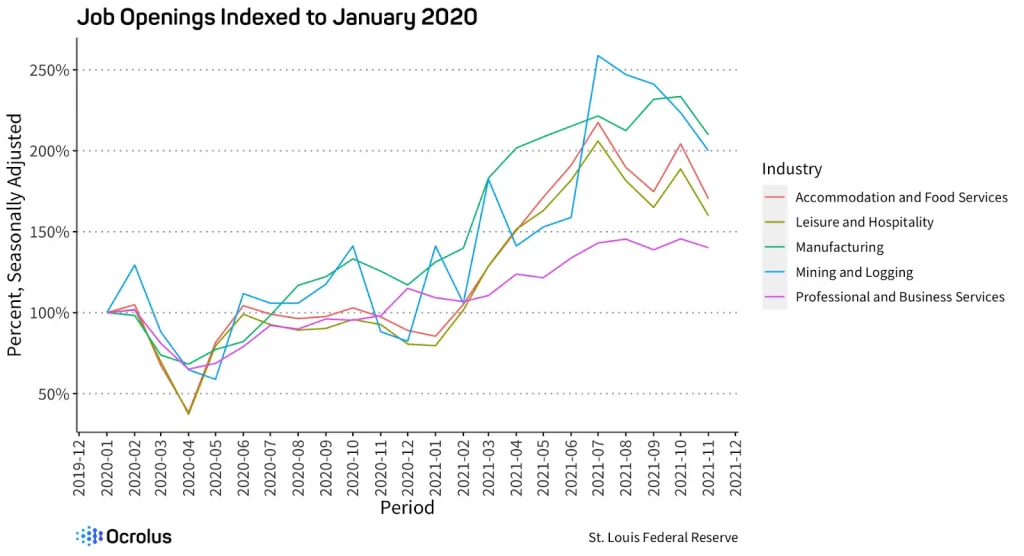
The U.S. as a whole lost more than 22 million jobs from the pandemic and at the end of 2021 still had 3.6 million fewer positions than in February 2020. The recent surge in Covid-19 cases slowed job growth last month, but the labor market is still tight with employers struggling to hire for the 11 million job openings. Compounding the effects of the labor shortages is the “Great Resignation” or the highest quit-rate ever recorded, factors which have forced many businesses, particularly those in retail and hospitality, to close or shorten hours.
With millions of people quitting or sidelined, the labor-force participation rate dropped to 61.9% in December, 1.5 points below the pre-pandemic level and down from a peak of 67% in 2000. If the U.S. maintained its employment-to-population ratio from 2000, we’d have more than 13 million more workers today, more than enough to fill the record number of open jobs.
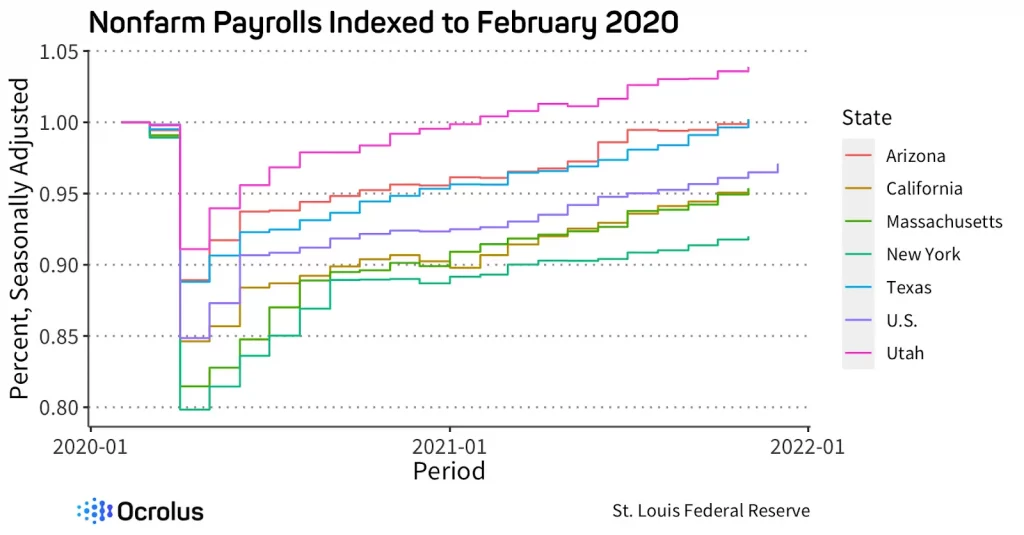
Reduced savings and a rising share of household debt relative to income may bring more workers off the sidelines, especially given the expiration of many federal support programs, including enhanced unemployment benefits and a beefed-up child tax credit. States that placed looser restrictions on businesses and ended enhanced unemployment benefits earlier were better positioned to recover the job losses from the pandemic.
Several additional factors continue to impact the health of small businesses in the U.S. The unemployment rate dropped again last month, helping to bid up wages at a faster pace than before the pandemic, particularly in labor-intensive, in-person industries like leisure and hospitality.
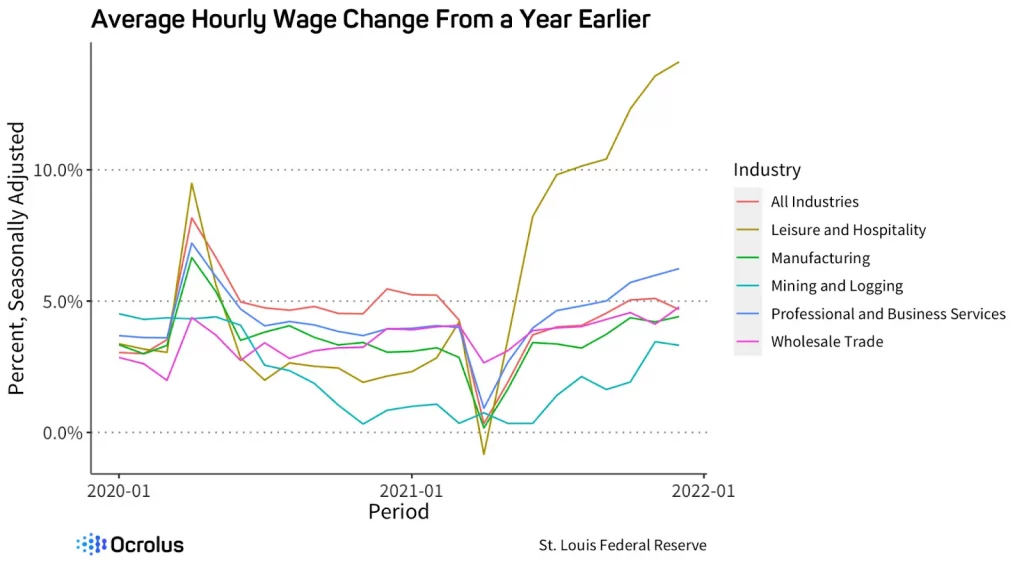
However, inflation rose to its fastest pace in nearly four decades as pandemic-related supply and demand imbalances, along with government stimulus, pushed prices up 7%, outpacing the 4.9% rise in wages.
About the Ocrolus Trending Small Business Health Index
Ocrolus is committed to supporting the lending community in its understanding of underlying credit risk with real-time income and cash flow analytics derived from bank account data and other sources. The combination of highly relevant external data at the regional level, combined with proprietary Ocrolus insights at the borrower level, provides a window into the resilience and prospects for recovery for millions of businesses in the U.S. This is what the Small Business Health Index seeks to capture — a real-time snapshot and statistics of the health of small businesses by industry and geography.
Sign up for our Ocrolus Insights Newsletter to receive the latest insights.

Scott
Monaco
Scott is an Associate Product Manager at Ocrolus with a background that spans global financial services from lending and credit to venture capital and insurance. Scott began his career as an investment banking analyst at Barclays where his experience encompassed capital raising, mergers and acquisitions, and global risk transfer solutions. From there, he moved to work in the third-party venture capital unit at Axis Capital where he was responsible for originating, structuring, and executing financing solutions across the insurance and financial technology sectors. Since joining Ocrolus in 2020, Scott has introduced a number of innovative cash flow analytics products to the market including Consumer Bank Statement Analytics.
Most recently Scott has published Ocrolus’ Small Business Health Index. This index, which is updated quarterly (see the most recent addition here), lays out the health of small businesses across the nation based on trends seen in Ocrolus’ own data and elsewhere.