Ocrolus Small Business Recovery Index

Last month marked the end of a seven-month run of job market gains. Even with the recent gains, more jobs have been lost — nearly 11 million — than were cut in the wake of the 2008-09 Financial Crisis, where 8.7 million were eliminated. According to Glassdoor senior economist Daniel Zhao, at November’s pace of job growth, employment will not return to pre-pandemic levels until 2024. Yet, at the same time, the net worth of U.S. households hit a record $123 trillion in the third quarter, up from 3.2% from the prior quarter, as stock portfolios and real estate holdings grew in value. The dissonant behavior of a wide-ranging set of market signals that consumers and businesses are sending about the state of the economy has made its underlying strength or weakness hard to discern.
Market irregularities are obscuring the resilience of small business recovery
The striking disconnect between what is happening in the economy and the consumer’s actual performance is evident in a number of places. Millions of Americans lost their jobs and skipped debt payments in the past seven months, yet their average credit scores are at an all-time high. Retail spending accelerated in the third quarter, but consumers did not rack up new credit card debt to fund it. Late payment and default rates have decreased in September from prior quarters, even after programs that gave borrowers a reprieve on repayments ended. Personal savings rates are on average three times as high as they were during the last recession, yet mortgage originations this year are on pace to surpass the lofty volume reached in the run-up to the 2008-09 Financial Crisis when lenders extended a record $3.7 trillion in 2003.
Data that has historically been viewed as a bellwether by economists and policymakers for a half-century are increasingly becoming less reliable indicators of the economy’s current health. This has important implications in the small business lending ecosystem. As banks reevaluate their underwriting models to account for and factor in latent risk, many are tightening lending standards, a phenomenon that has cascading effects for small businesses whose principal source of outside financing are bank loans (in contrast to large, public companies who have ready access to capital markets for funding).
Small Business Recovery Index
Ocrolus is committed to supporting the lending community in its understanding of underlying credit risk with real-time income and cash flow analytics derived from bank account data and other sources. The amalgamation of highly relevant external data at the regional level, combined with proprietary Ocrolus insights at the borrower level, provides a window into the resilience and prospects for recovery for millions of businesses in the U.S. This is what the Small Business Recovery Index seeks to capture — a real-time snapshot of the health of small businesses by industry and geography.
The Index comprises normalized and weighted industry and geography scores based on raw data from a variety of macroeconomic indicators, including economic mobility, housing prices, and small business pulse surveys, as well as from a mixture of microeconomic indicators including average daily balance and small business loan application volume. Indexed scores are quantified based on relative differences in ongoing reporting data from pre-pandemic baseline levels. In other words, a September median home sale price reading in New York would not be compared to one in Kentucky directly, but rather these statistics would be compared to January & February 2020 levels in each respective locale. Once these scores from disparate data sources are quantified and added up, we then classify them into deciles that provide a relative ranking for how different metropolitan statistical areas (MSAs) and NAICS industry categories compare against each other.
Building the Small Business Recovery Index in this way allows us to see, in real-time, how specific pockets of the country are recovering from the pandemic at a granular level, while also assessing the state of economic activity for different industry classification groups. In addition, our Small Business Recovery Index captures the unevenness of recovery that the government’s response to the pandemic elicited, as Federal relief programs for mortgages and student loans were relatively easy to get and flexible while programs for credit cards, auto and personal loans were more happenstance.
Small business industry findings
The economy has mounted a split recovery from the country’s pandemic-driven economic turmoil, as some workers, companies, and regions show signs of coming out strong while other cohorts are stuck on the descending arm of the often-cited “K-shape” recovery. Bars, restaurants and hotels by themselves account for more than a quarter of the roughly 10 million jobs lost between February and October, according to the Labor Department. Our Index Recovery scores confirm the two-track nature of the recovery (see appendix for a list of the top 10 and bottom 10 NAICS industry categories by recovery, as of December 2020).
In particular, it displays consistently strong signals from a handful of industries that have benefitted from the pandemic-forced transformation of consumer behavior towards more openly embracing digital commerce — changes that may prove permanent. The lockdowns, social distancing and other effects of the crisis forced many consumers to try online shopping, medical appointments, fitness classes and educational services, further entrenching the positions of companies and industries on either end of the broader economy’s K-shaped recovery.
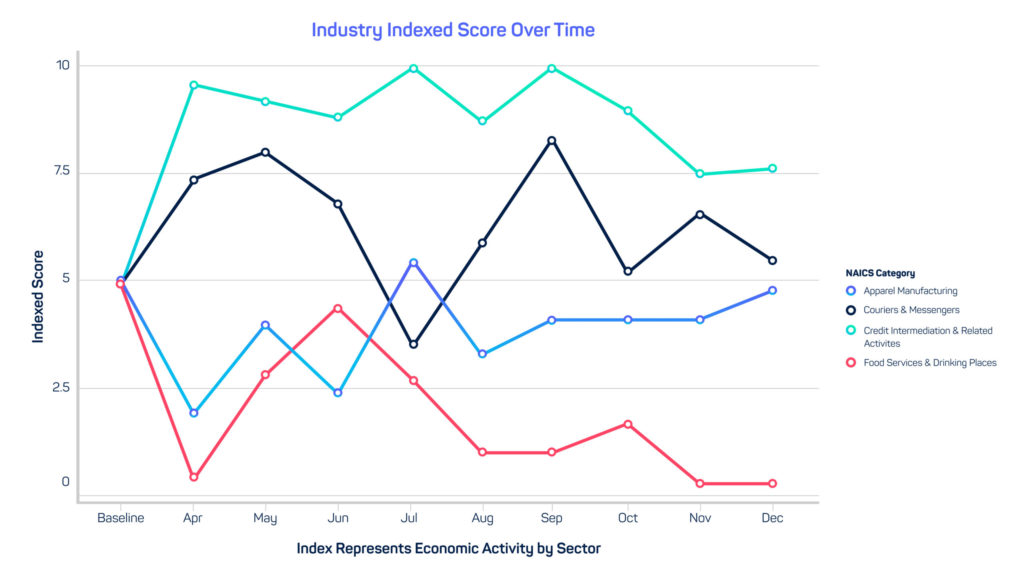
Among those industries that have scored well include businesses that serve groups in the insurance, professional services, and investment industries. Other enterprises scoring well included the warehousing and transportation industries — the ones that package, ship and deliver goods to consumers; couriers and messenger jobs — workers who deliver goods; and home-improvement stores — thanks to low mortgage rates and demand for larger living space. On the other hand, among those industries that have scored poorly include clothing and accessory stores — jobs that serve customers in person, casinos and theaters, and apparel manufacturing.
Geographic findings
The pandemic’s economic effects ripple unevenly across geography, too. For example, travel bans and worries about air travel have devastated tourism-dependent economies from Hawaii to Las Vegas. However, while associations between lockdowns and coronavirus cases to Small Business Recovery Index scores are evident, they do not explain the whole picture.
For example, Florida is also a tourism-heavy domicile but has seen less job loss and faster recovery than states such as New York. In fact, New York is home to 7 of the 10 worst MSAs as scored by the Recovery Index (see appendix for a list of the top 10 and bottom 10 counties by recovery, as of December 2020). Our Index results on a geographic basis point to two important findings: 1. Economic divergence in small business resilience occurs not just among regions, but, more notably, within them. 2. The regional data suggest it is not the level of Covid-19 infections, but how state officials, businesses and consumers respond to the pandemic that appears to have a strong impact on the pace of recovery in a region.
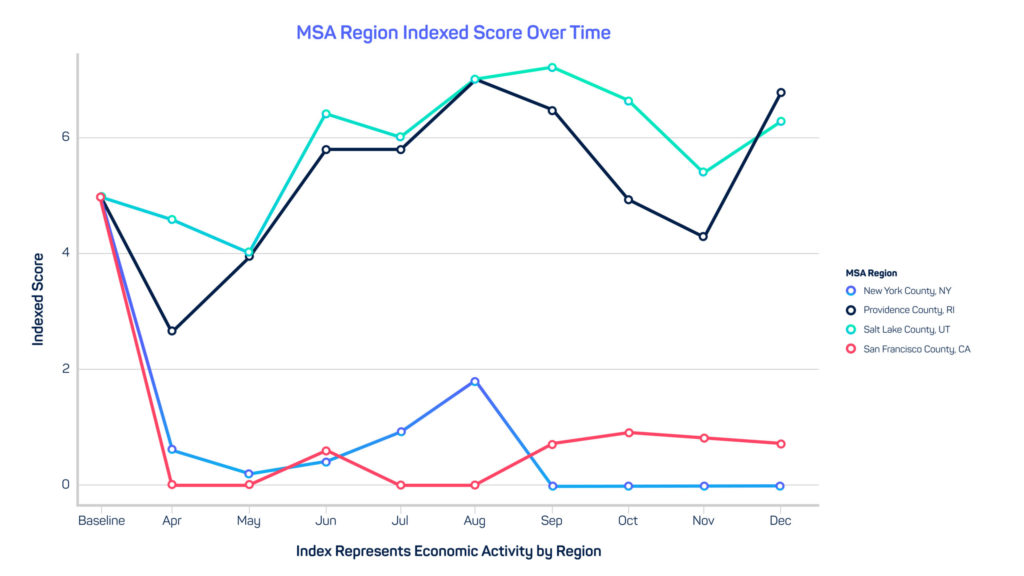
Among those regions of the country that have scored well: pockets of the Mid-Atlantic that are home to many of the industries discussed above that are recovering best, such as finance and technology; tech-forward western states; areas of America’s Mountain West region that were already seeing growth in migrations from young professionals who viewed these locales as lower cost alternatives for professional service industries. Among those that have scored poorly: certain parts of the Midwest that have struggled since Labor Day and coastal areas surrounding New York and Los Angeles that have been subject to stringent restrictions on businesses.
Conclusion
A number of factors cloud the horizon for the pace and timing of economic recovery. The use of traditional data and metrics such as non-farm payrolls, the 10-year Treasury yield, and FICO scores to forecast the health and vitality of consumers and small businesses are increasingly obscured by fundamental changes in the way we work and consume, central bank intervention in the economy, and the government’s relief programs that allow millions to defer payments with little to no effect on borrowers’ credit reports.
Using the combination of external data sources with bank account data at the individual borrower level, the Small Business Recovery Index provides a timely and fresh perspective on the health of the economy — including insights into which areas of the country and which industries the government may want to target in future relief efforts.
Further, the Index can help industry executives and loan officers track how small businesses respond to payment trends that could change in the winter as cities and states deal with the economic impact of rising numbers of coronavirus cases, job losses that were temporary and are now permanent, and the absence of additional stimulus on debt capacity and growth.
We hope these ongoing insights will enable banks and fintech lenders to extend credit with confidence to small businesses, which have consistently been the major source of job growth for the U.S. economy.
Appendix
| Top_Ten_NAICS | Recovery_Score | Trending_Category |
| Securities, Commodity Contracts and Other Financial Investments and Related Activities | 10.0 | Flat |
| Credit Intermediation and Related Activities | 7.6 | Flat |
| Other Information Services | 7.6 | Up |
| Professional, Scientific, and Technical Services | 7.6 | Flat |
| Real Estate | 7.6 | Flat |
| Telecommunications | 7.6 | Up |
| Insurance Carriers and Related Activities | 7.3 | Down |
| Utilities | 7.3 | Flat |
| Data Processing, Hosting, and Related Services | 7.0 | Flat |
| Wholesale Electronic Markets and Agents and Brokers | 7.0 | Flat |
| Bottom_Ten_NAICS | Recovery_Score | Trending_Category |
| Personal and Laundry Services | 0.0 | Down |
| Food Services and Drinking Places | 0.3 | Flat |
| Amusement, Gambling, and Recreation Industries | 1.2 | Up |
| Transit and Ground Passenger Transportation | 1.5 | Up |
| Accommodation | 2.1 | Flat |
| Beverage and Tobacco Product Manufacturing | 2.4 | Down |
| Clothing and Clothing Accessories Stores | 2.4 | Down |
| Educational Services | 2.4 | Flat |
| Museums, Historical Sites, and Similar Institutions | 3.6 | Flat |
| Support Activities for Mining | 3.6 | Down |
| Top_Ten_Counties | Recovery_Score | Trending_Category |
| CLAY COUNTY, FL | 10.0 | Up |
| BUTLER COUNTY, KS | 9.8 | Up |
| CHRISTIAN COUNTY, MO | 9.8 | Up |
| ST. JOHNS COUNTY, FL | 9.8 | Up |
| TIPTON COUNTY, TN | 9.8 | Up |
| WEBSTER COUNTY, MO | 9.8 | Up |
| SEVIER COUNTY, TN | 9.5 | Down |
| WARRICK COUNTY, IN | 9.5 | Up |
| WASHINGTON COUNTY, WI | 9.5 | Up |
| BRYAN COUNTY, GA | 9.3 | Up |
| Bottom_Ten_MSAs | Recovery_Score | Trending_Category |
| NEW YORK COUNTY, NY | 0.0 | Down |
| SAN FRANCISCO COUNTY, CA | 0.7 | Down |
| QUEENS COUNTY, NY | 1.3 | Flat |
| BRONX COUNTY, NY | 1.7 | Flat |
| KINGS COUNTY, NY | 1.7 | Flat |
| LOS ANGELES COUNTY, CA | 1.7 | Up |
| RICHMOND COUNTY, NY | 1.7 | Flat |
| WESTCHESTER COUNTY, NY | 1.7 | Flat |
| PUTNAM COUNTY, NY | 2.2 | Up |
| MARIN COUNTY, CA | 2.4 | Flat |
Download the PDF of this article