Solar Eclipse 2024 – Shining a light on small business cash flow

The upcoming solar eclipse on Monday, April 8, is captivating the world. People everywhere are making plans to witness a rare celestial event that will not happen again for another 20 years.
While the sun and moon make their course toward alignment in space, multiple organizations have noted the economic implications of the eclipse here on Earth. For example, Airbnb occupancy rates in the 150-mile-wide total eclipse path are substantially higher than elsewhere in the United States. The U.S. Bureau of Labor Statistics has also gotten in on the action, sharing a heatmap of employment and wages in the ‘eclipse belt.’
The Ocrolus team even ordered special eclipse glasses to hand out at the ICE Experience Conference last month.

Given the presence of 1.1 million business establishments in the eclipse belt, it would be interesting to explore small business applications and cash flow data in this geographic area and benchmark it against the rest of the country. Over the past several years, Ocrolus has processed over 10 million applications for small business credit on behalf of our clients, providing a vast and deep dataset for such an exploration. Note that for this analysis, we will show cash flow data through the end of 2023. We will release Q1 2024 small business cash flow data during late Small Business Week later this month as part of the Ondeck-Ocrolus Small Business Cash Flow Trend Report.
Revenue
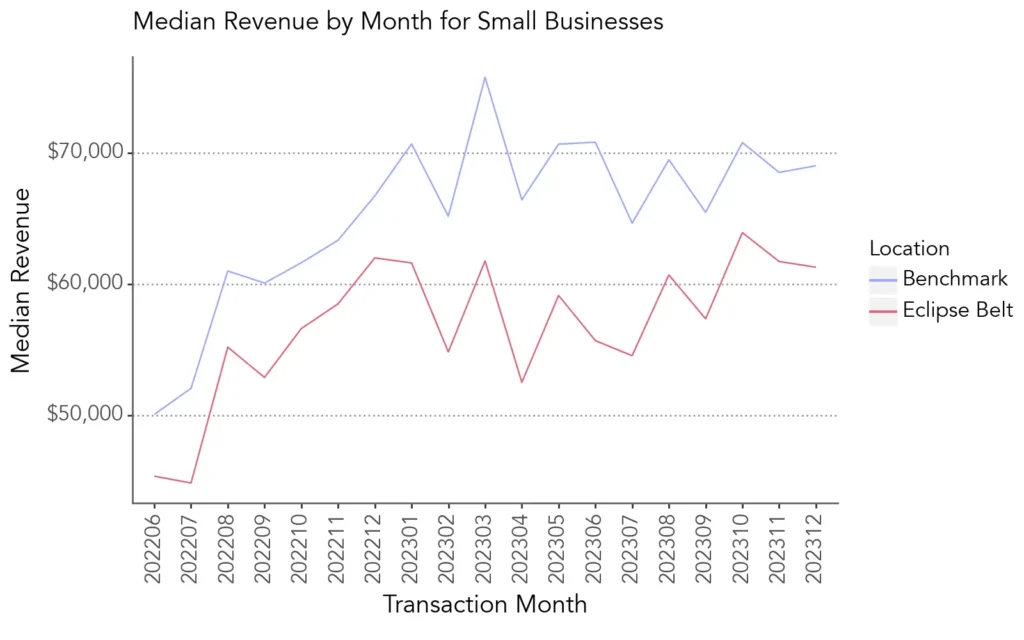
The graph below shows the median monthly revenue of small businesses applying for credit, split between those in the eclipse belt vs. the rest of the United States. As we can see, while the 2 cohorts follow the same general trend and seasonality, businesses in the eclipse belt have around 12% less revenue than their benchmark peers in the months immediately preceding a loan application.
The interactive map shows median monthly small business revenue at a county level for locations in the eclipse belt.
Cash flow
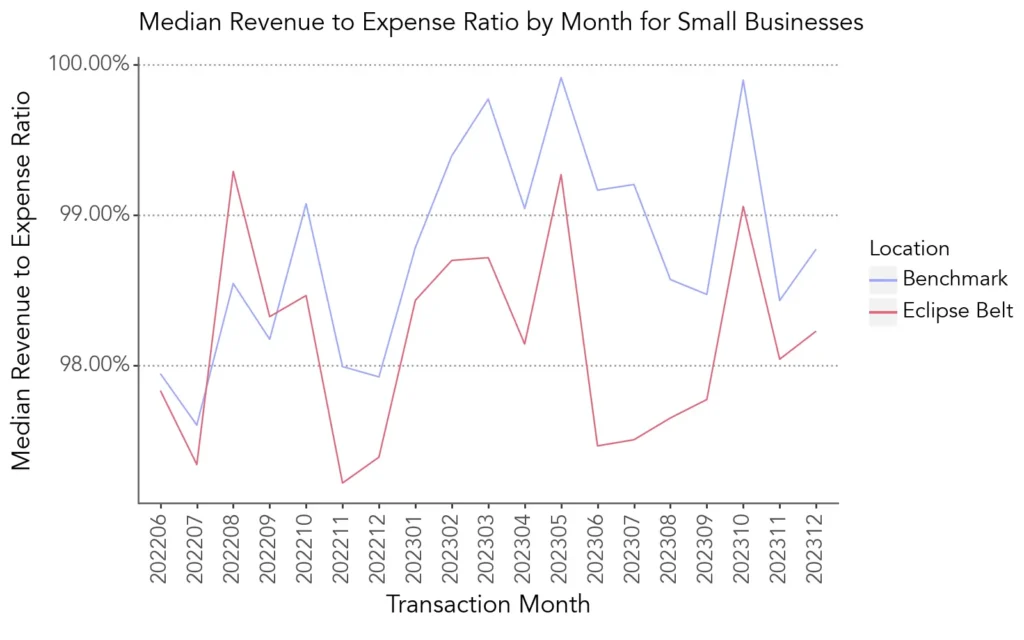
A fundamental fact of Main Street small businesses is that they operate very close to the margin, with revenue and expense numbers that often look strikingly similar at a monthly level. Businesses frequently need to incur present-month expenses to ensure future-month revenue, underscoring the criticality of working capital financing for small business health. On this metric, eclipse-belt businesses align with the benchmark, with a ratio only 54 bps lower.
The interactive map below shows the revenue-to-expense ratio at the county level. Kudos to Hays County, Texas, for having a ratio of 113%!
Payroll expense
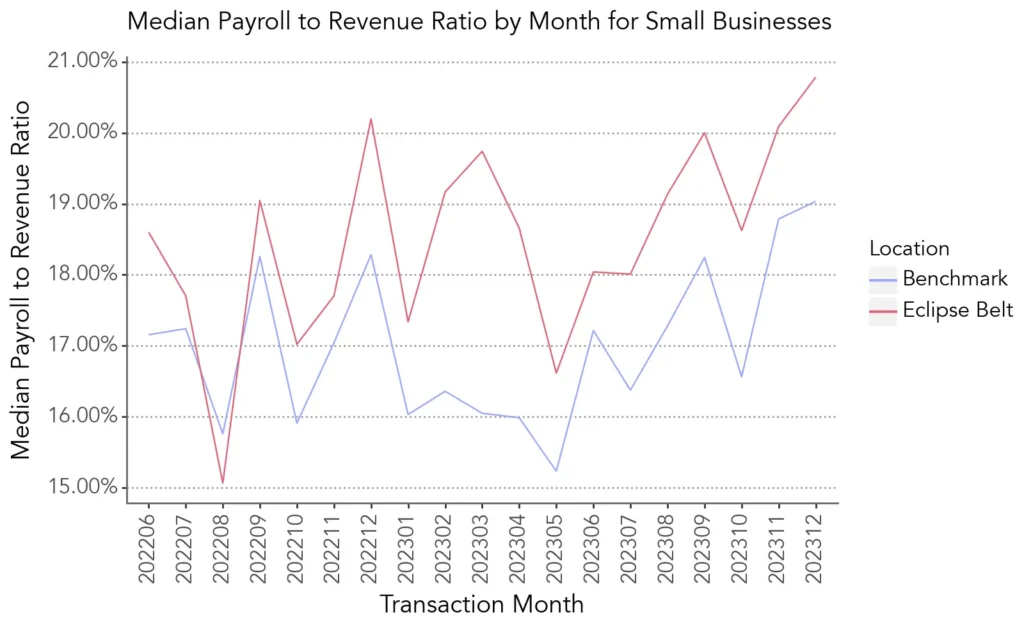
Payroll costs are of great importance to all firms, and labor-market inflation has especially affected small businesses. Over the past year, we can see an increase in the portion of business revenues spent on payroll, rising to a median of nearly 20%. Businesses in the eclipse zone appear to have proportionally higher payroll expenses by 175 bps. Of course, this is more likely a composition effect based on the various sizes and industry categories of businesses in the respective regions.
Bank balance
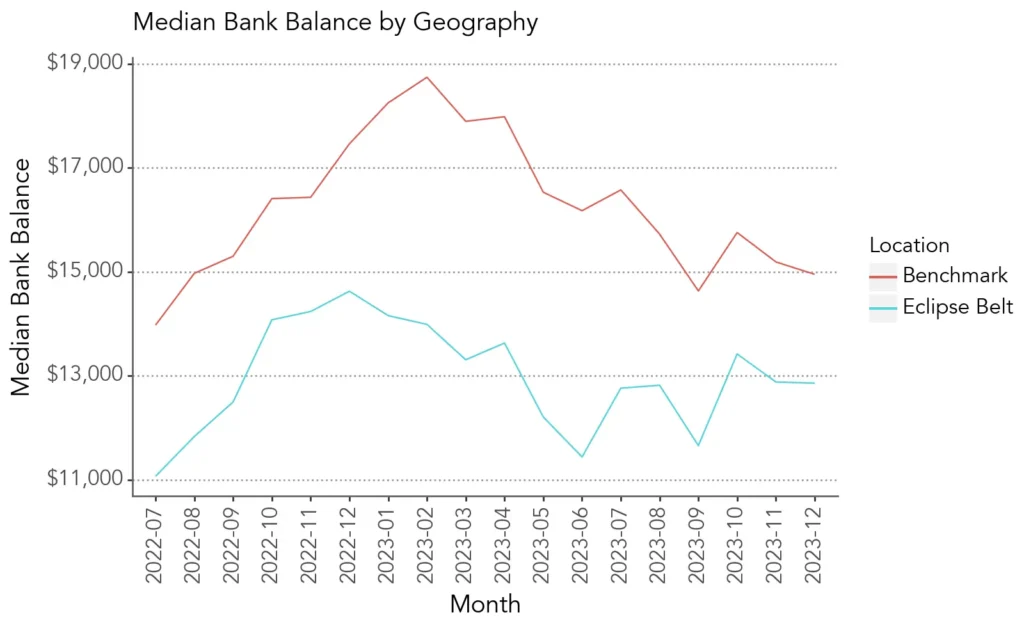
The median small business applying for credit in December 2023 had a bank balance of approximately $13k. The graph below shows that businesses in the eclipse belt have markedly lower bank balances, over 16% lower than the benchmark.
The plot below shows interactive bank balances by country. This metric has a massive degree of variation, even when removing counties with a low sample size. For example, small businesses applying for credit from Bowie Country, Texas, show a median bank balance of $463k, whereas those in Stark County, Ohio, show a median bank balance of $2,338.
Application volume
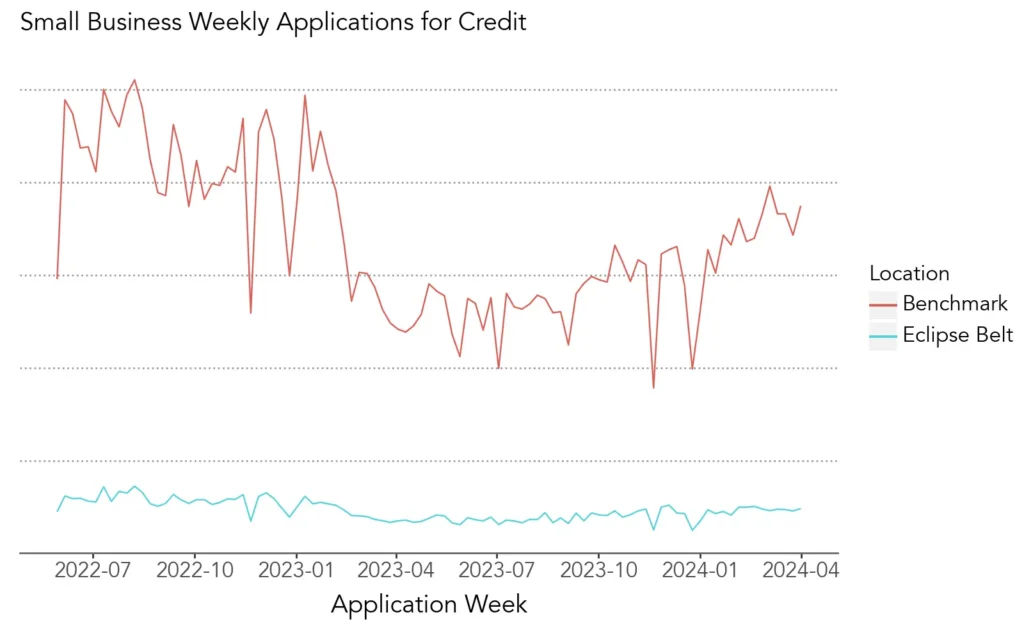
For this view, we’ll go against the earlier-stated end-of-2023 limit and show data up to the present day—the below chart of weekly applications for credit yields 2 particular observations. First, we see an obvious decrease in application volume from early 2023, as higher interest rates suppressed demand for credit, and higher capital costs caused lenders to reduce their customer acquisition expenses. Second, while we see a national increase in small business credit applications over the past 2 quarters, the effect is incredibly muted among locations in the eclipse belt vs. their benchmark peers.
Additional thoughts
It’s essential to note amidst our eclipse mania that this analysis involves large cohorts of millions of businesses varying in size, age, and industry focus. We can be confident that many of the differences shown here are explained by other variables far more important than their coincidental location relative to a once-in-20-years astronomical event!
Nevertheless, our visualizations somewhat unexpectedly show businesses in the middle of the country not faring quite as well as those on the coasts. Hopefully, all the eclipse-related business will be a boon to these areas economically, and we will closely monitor the data for signs of impact over the coming months.