SMB credit in the new year: Cash flow insights from the first week of 2026

After an action-packed and unusually eventful start to the year, it’s hard to believe that we are only 13 days into 2026! At the risk of debating the time when it stops being acceptable to wish someone a “happy new year”, let’s just say that it’s always fascinating and instructive to witness the annual, post-holiday kick-off for one of the most vibrant and critical segments of our economy, that of U.S. small businesses.
Small businesses contribute 46% of all U.S. employment and account for 43% of GDP. Credit is a technology that enables people, businesses, and even governments to make investments in the future, and the accessibility of capital to small businesses has a direct and significant impact on economic growth and prosperity. At Ocrolus, we analyze approximately half a million SMB credit applications per month, providing us with a privileged view on business’ liquidity, financial operating dynamics, and appetite for credit. In this analysis, we’ll explore data from the first 5 business days of 2026 and compare it to the analogous period from 2025.
At a high-level:
- SMB credit demand is up in early 2026, with healthy applicant behavior and less high-intensity shopping.
- Business financial profiles remain stable year over year, even as leverage and credit relationships increase.
- Payment behavior is shifting rapidly toward digital rails, with emerging risk signals like crypto and gambling becoming more prevalent.
Volume and distribution
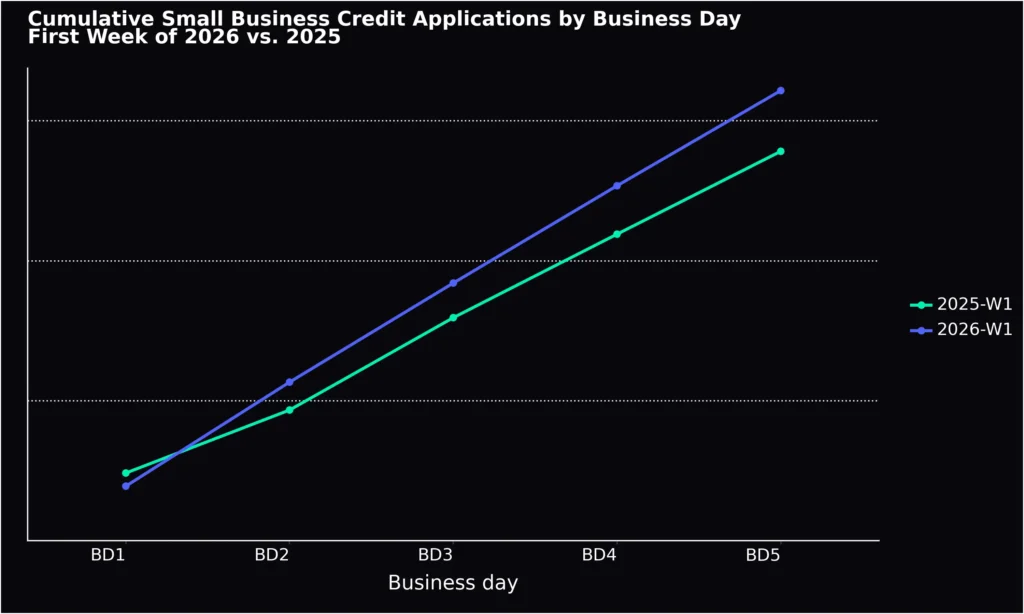
Small business appetite for credit in 2026 is off to a strong start. After a slightly slower BD1 (Friday, 1/2), application volume pulled ahead and finished week 1 at 16% higher than 2025.
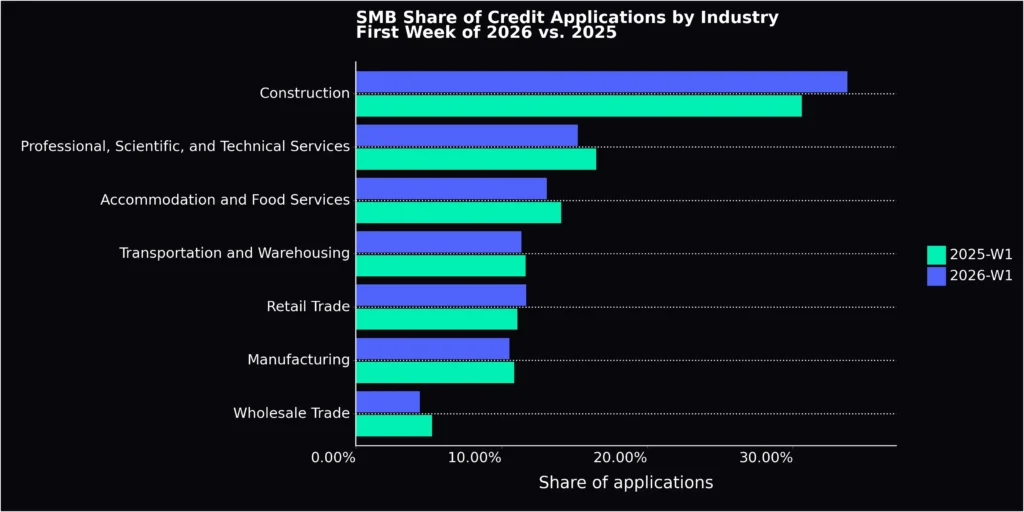
Application volume by industry remained fairly stable, with the largest percentage increase in the construction industry and the largest percentage decrease in the accommodation and food services industry.
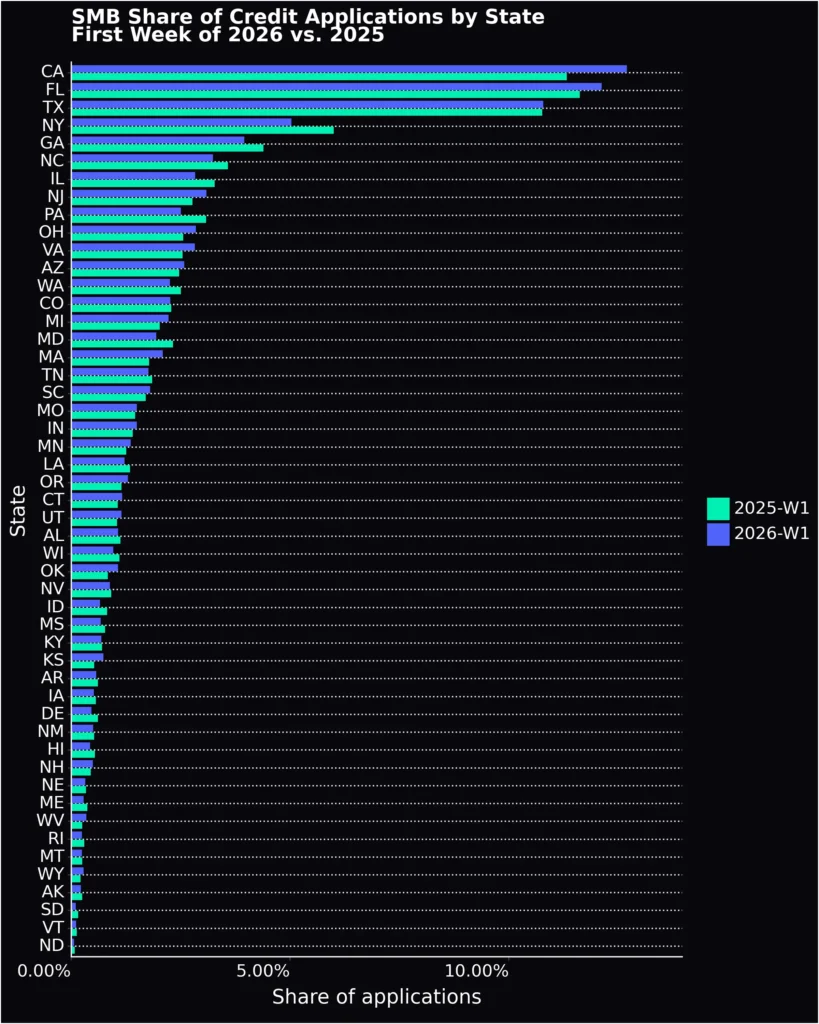
While geographic distribution of SMB credit applications is predictably tied to population, we do see some changes at the state level, with CA and FL increasing their share and NY and GA falling behind.
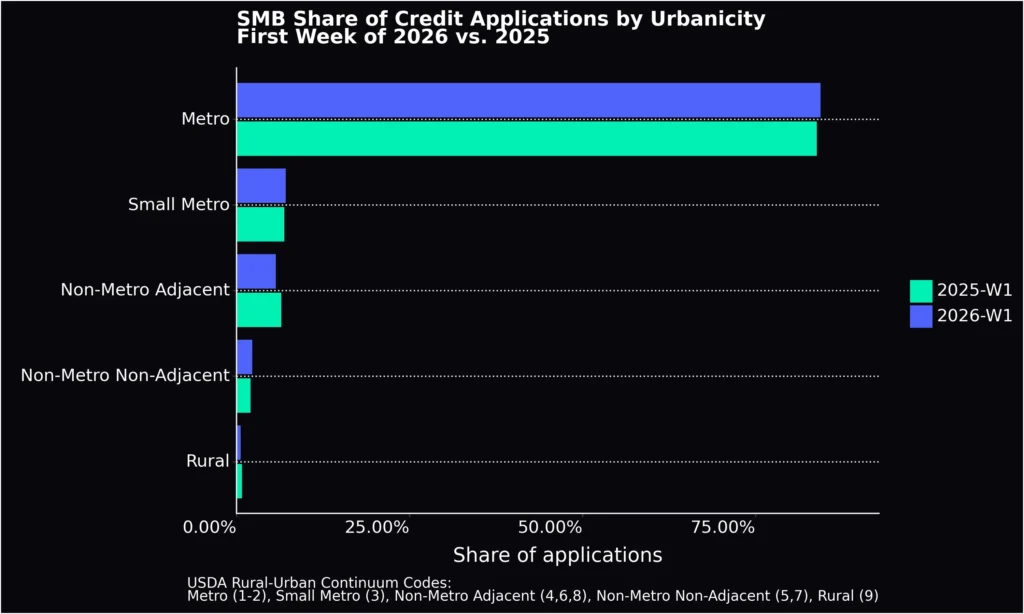
Urbanicity is another lens for understanding the distribution of application flow by geography. In the graph below, we compare volume share by mappings of the USDA’s Rural-Urban Continuum Codes, finding very little difference year over year.
Cash flow analysis
Detailed, time-series bank transaction data provides a precise window into the cash flow, debt capacity, and financial health of a business and has become the primary analytical data source for the leading small business lenders in the U.S. Ocrolus performs advanced cash flow analysis for nearly 200 such lenders, sourcing the data from documents as well as open banking aggregators.
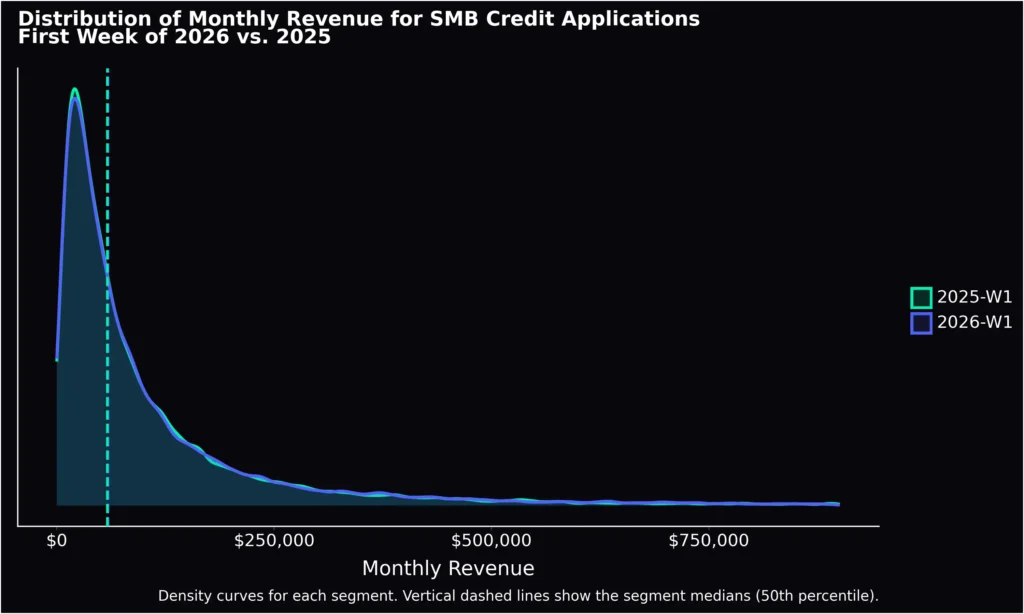
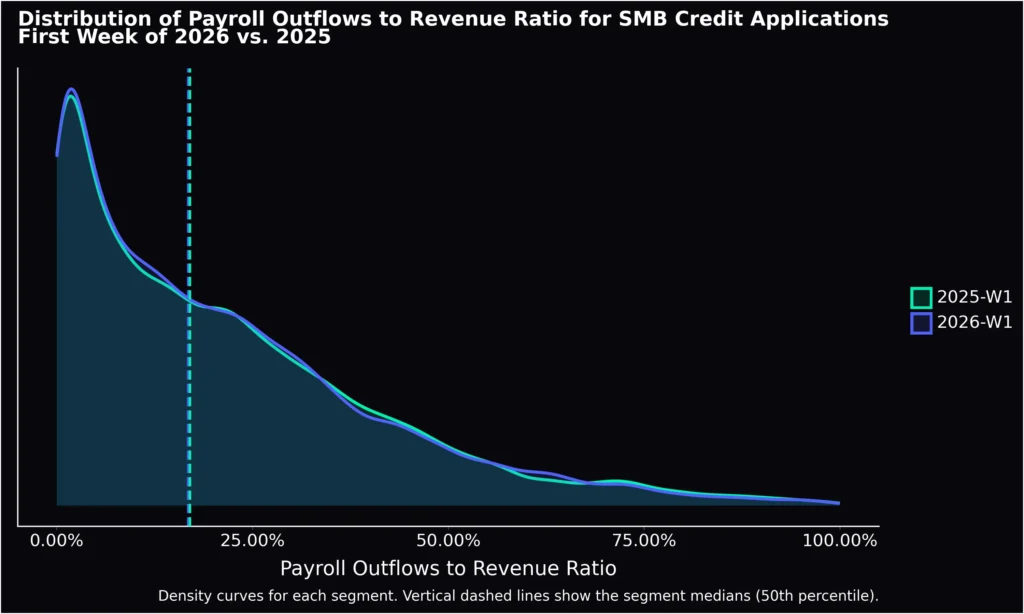
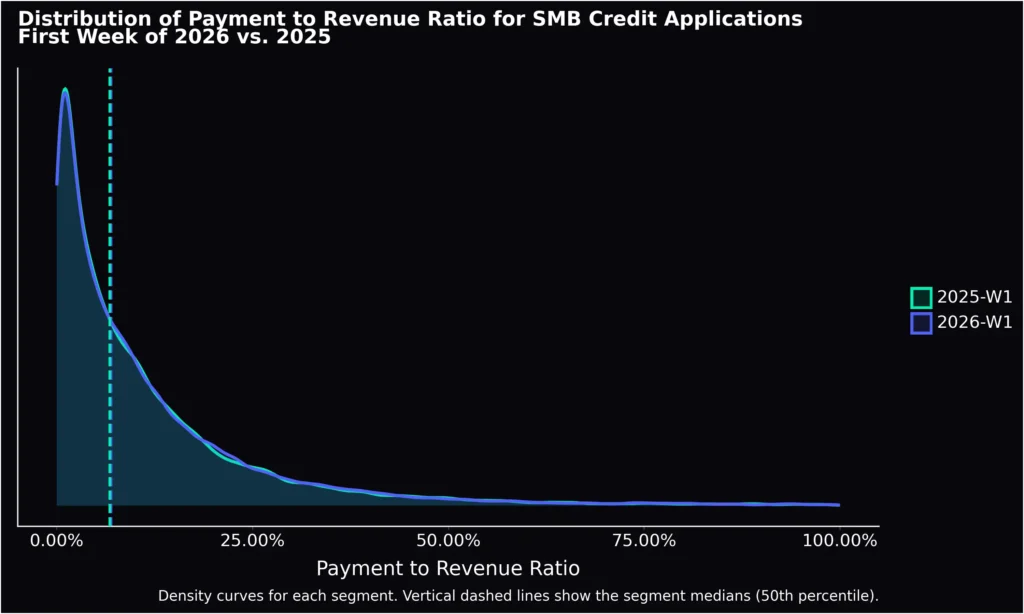
In the graphs below, we visualize several high-level cash flow metrics or ratios and compare the first week of applications for this year vs. the last. When comparing monthly revenue, payroll-to-revenue ratio, and debt payments-to-revenue ratio, the two populations are remarkably similar. This would indicate that the financial condition of businesses applying for credit has not changed materially since the beginning of 2025. It may also be a sign that lenders have not made material changes to their borrower acquisition strategy or channel mix, at least not to a degree that it would show up in industry-wide statistics.
Credit-seeking behavior
Given the size of our customer base and the reach of the Ocrolus product, we typically see multiple applications for an individual small business – across multiple lenders and time periods. As such, we know how many times we’ve seen an applicant within various prior time intervals. This is analogous to the concept of ‘inquiries’ on a consumer credit bureau, but for a population – U.S. small businesses – for which credit-seeking behavior is typically harder to track.
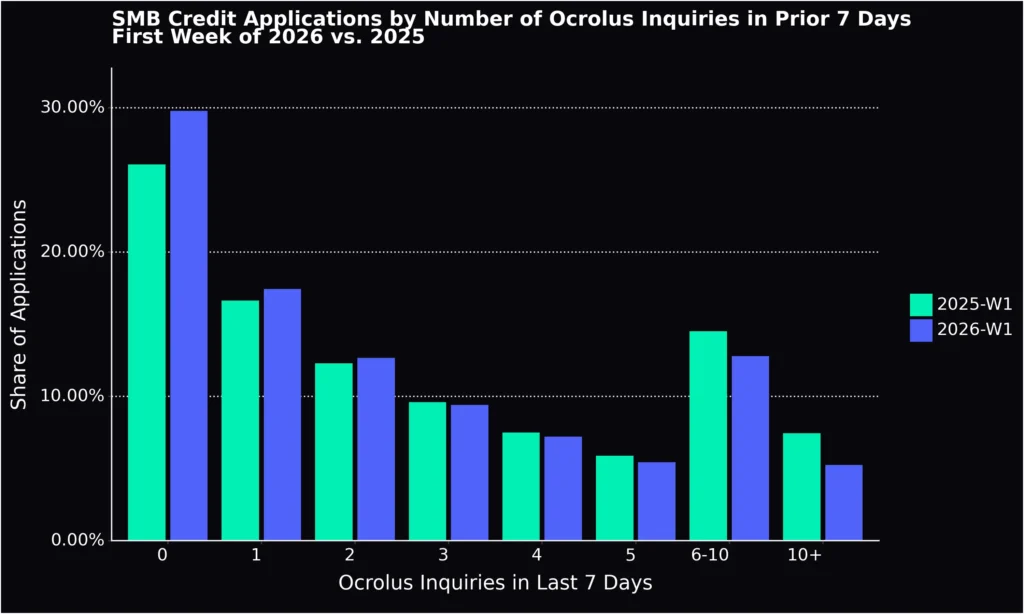
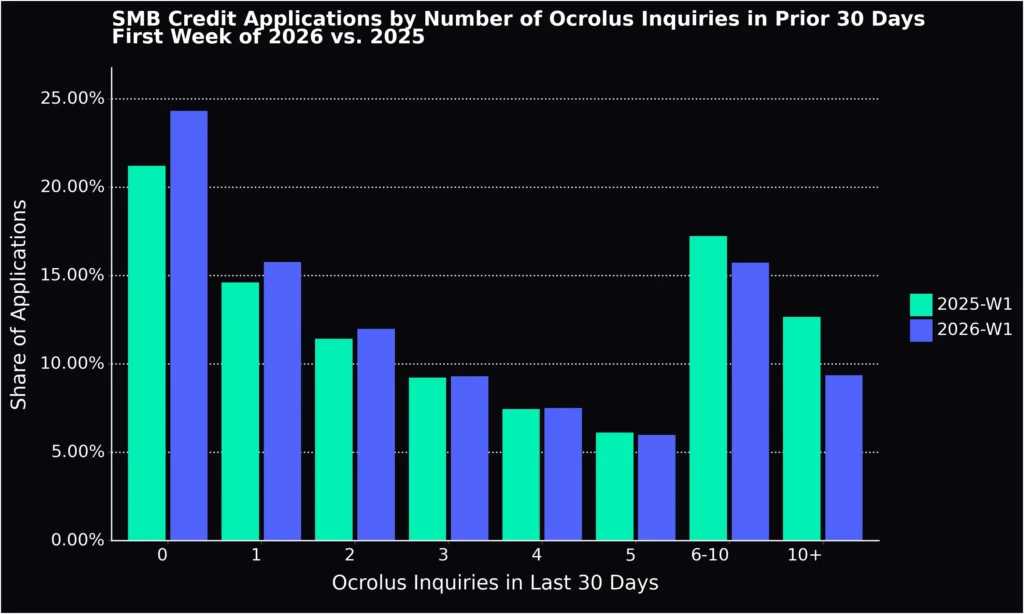
The charts below display the distribution of SMB credit applications by number of previous applications in the prior 7 days and 30 days, respectively. This shows that for a given application we receive, it is ~70% likely that we’ve seen another application from that business in the prior week. However, the distribution has shifted somewhat in the past year, from which we can observe:
- A year-over-year decline in high-intensity shopping. This may be attributed to improved broker/lender matching or tighter fraud or lead-quality controls upstream.
- An increase in not-recently-seen or “clean” applicants. This suggests that a larger cohort of borrowers is entering the funnel earlier in their shopping process or is being more targeted before applying.
- Mid-range inquiry behavior is largely stable, suggesting that “normal” comparison-shopping behavior among SMBs hasn’t materially changed.
Employment
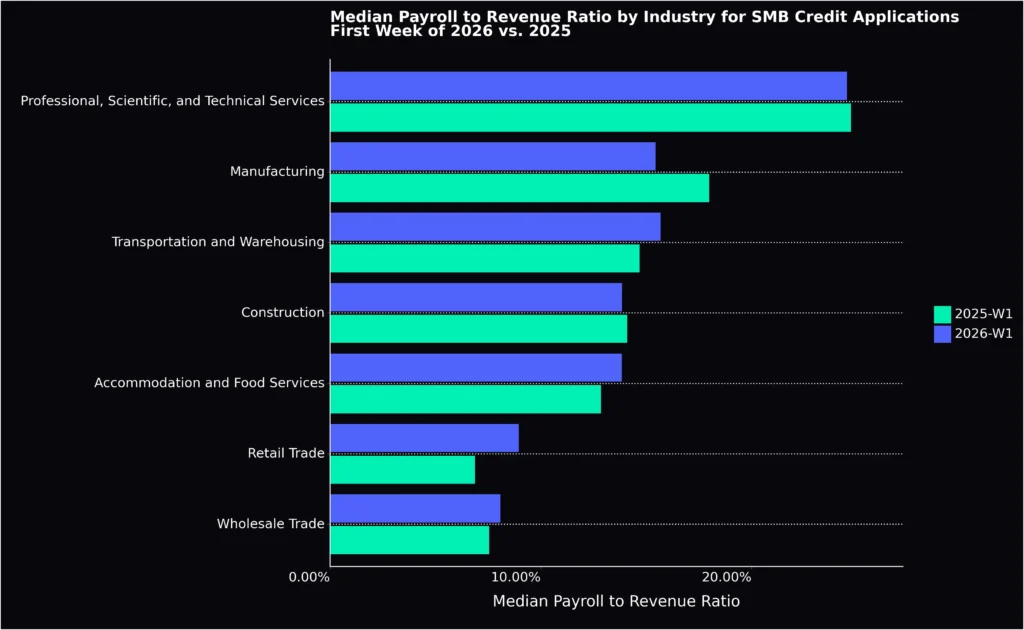
High-fidelity cash flow data is a critical input to understanding the financial dynamics of a small business applying for credit. For employer firms, the payroll-to-revenue ratio is a useful metric to understand the proportional cost of labor.
In the graph below, we show the payroll-to-revenue ratio by industry for the 2 time periods in question. The ratio has decreased most in manufacturing and increased the most in retail, which likely reflects the labor markets in those industries, particularly given the former’s exposure to tariff-related uncertainty.
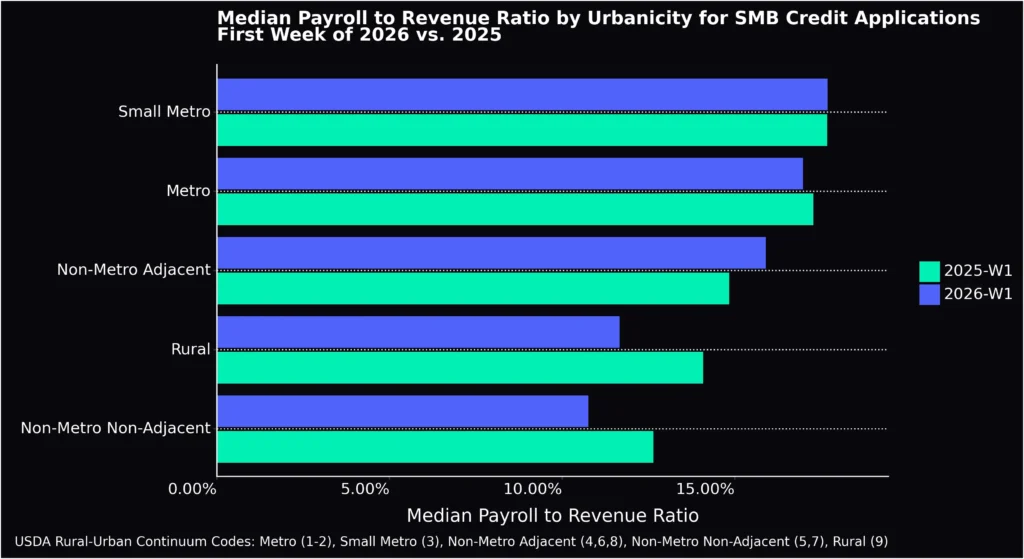
We can also analyze the payroll-to-revenue ratio by the same rural-urban segmentation we used above. In the graph below, we see the sharpest decline in the “Rural” and “Non-Metro, Non-Adjacent (to a city)” segments.
Debt capacity
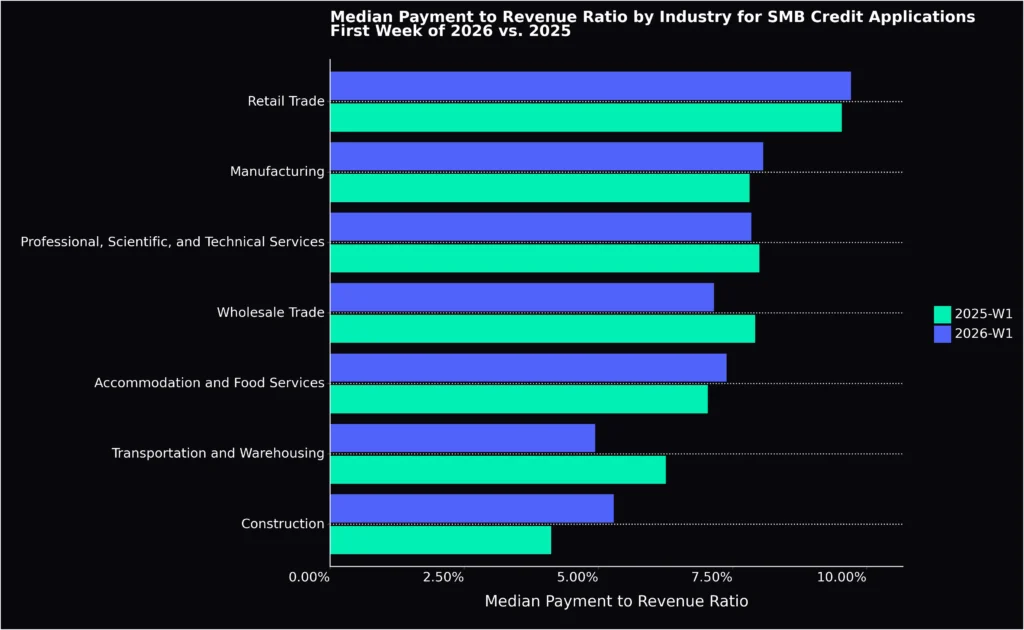
Identifying debt-related proceeds and payments is a requirement for lenders and funders seeking to measure the capacity of a business to take on and service new debt obligations. Using Ocrolus cash flow analytics, we can compare the debt payment-to-revenue ratio by industry across the two time periods in question.
In the graph below, the construction industry stands out as having the highest increase, which is particularly interesting given that the industry also had the highest rate of application growth.
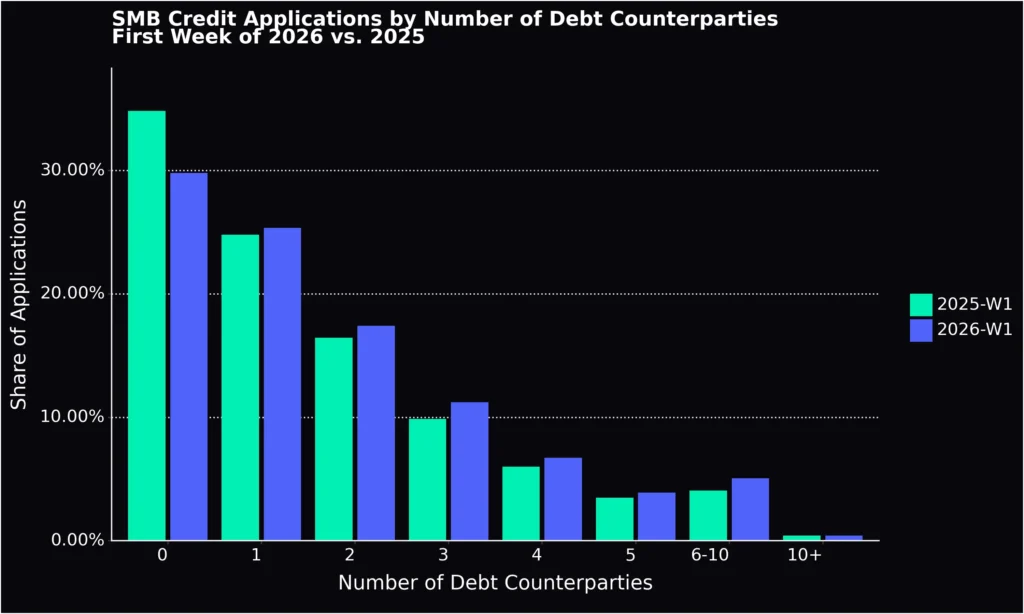
It’s also possible to analyze the distinct number of creditor counterparties that show up in each applicant’s bank data. From the first week of 2025 to the analogous time period in 2026, the distribution has shifted rightward, indicating a decrease in applicants with no existing debt and a general trend toward a greater number of credit relationships, or ‘positions’.
Payment methods
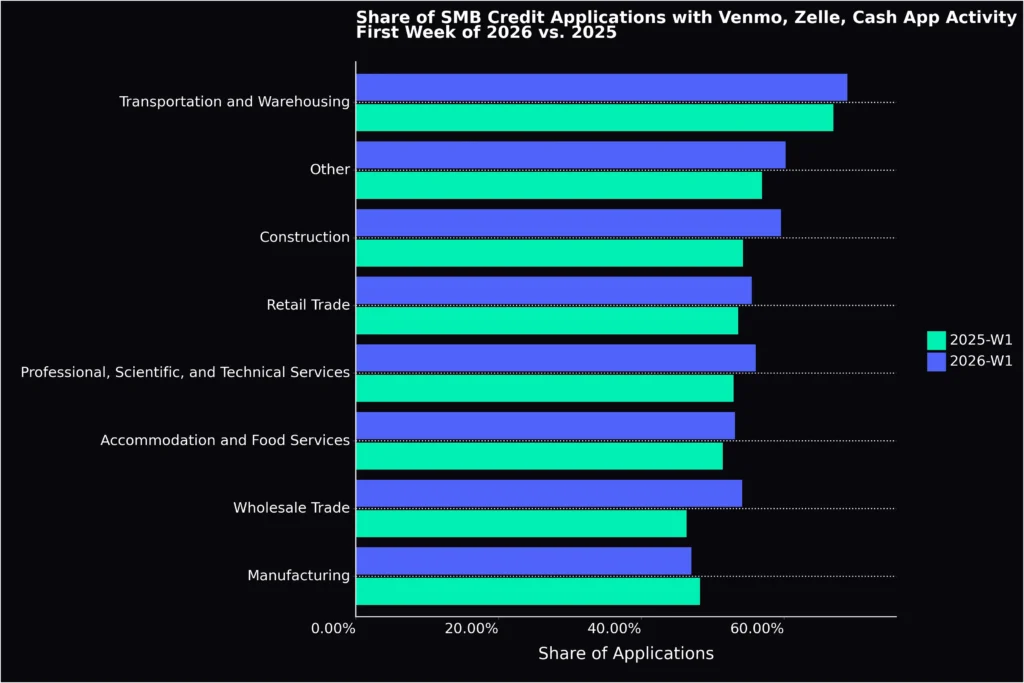
The new year is a good time to examine the rapidly evolving landscape of business payment methods. In the chart below, we see the percentage of SMB credit applications with Venmo, Zelle, or Cash App payments. Notably, the penetration of digital payments has increased in every segment other than manufacturing.
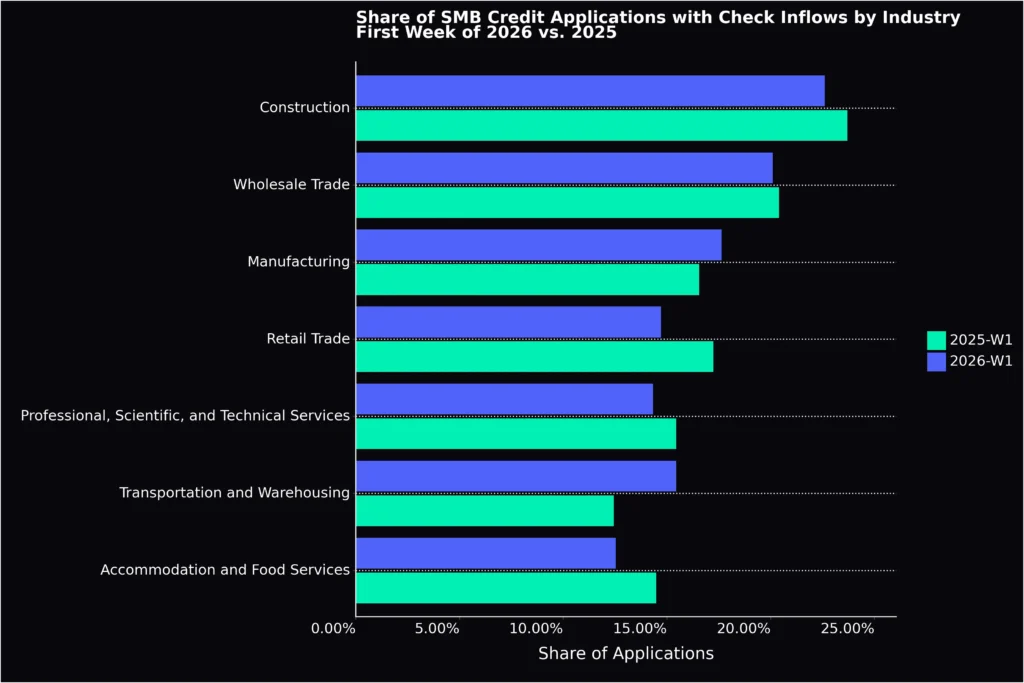
As one might expect, the trend is not as positive for the use of checks. The chart below shows the prevalence of SMB applications with deposits from checks, which has decreased across the board with few exceptions.
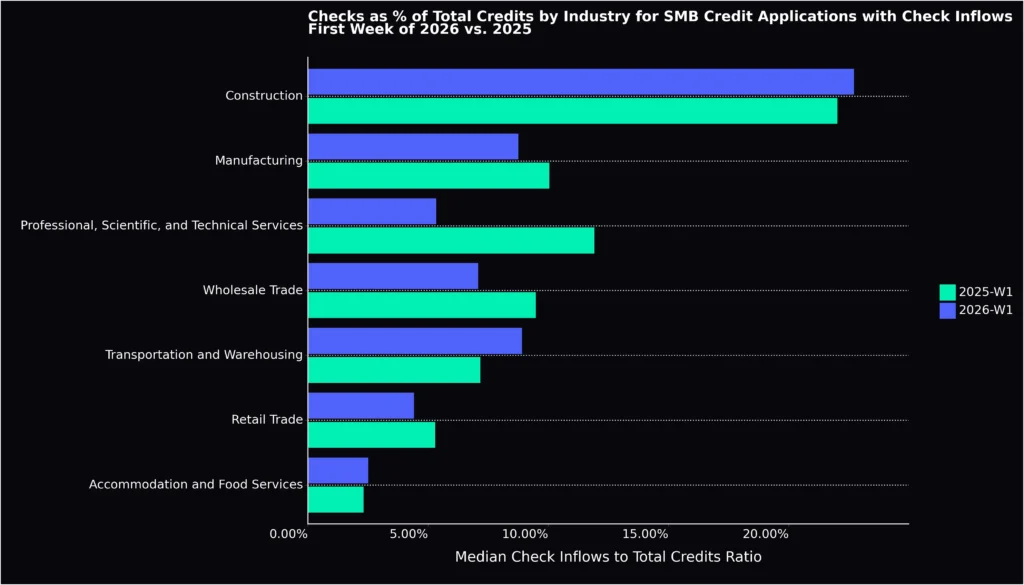
This next chart goes a level deeper, showing the dollar-weighted % of deposits from checks for all businesses with at least 1 check deposit. Construction is predictably the heaviest user of checks, whereas it is a much less relevant payment acceptance method in the hotel and restaurant industry.
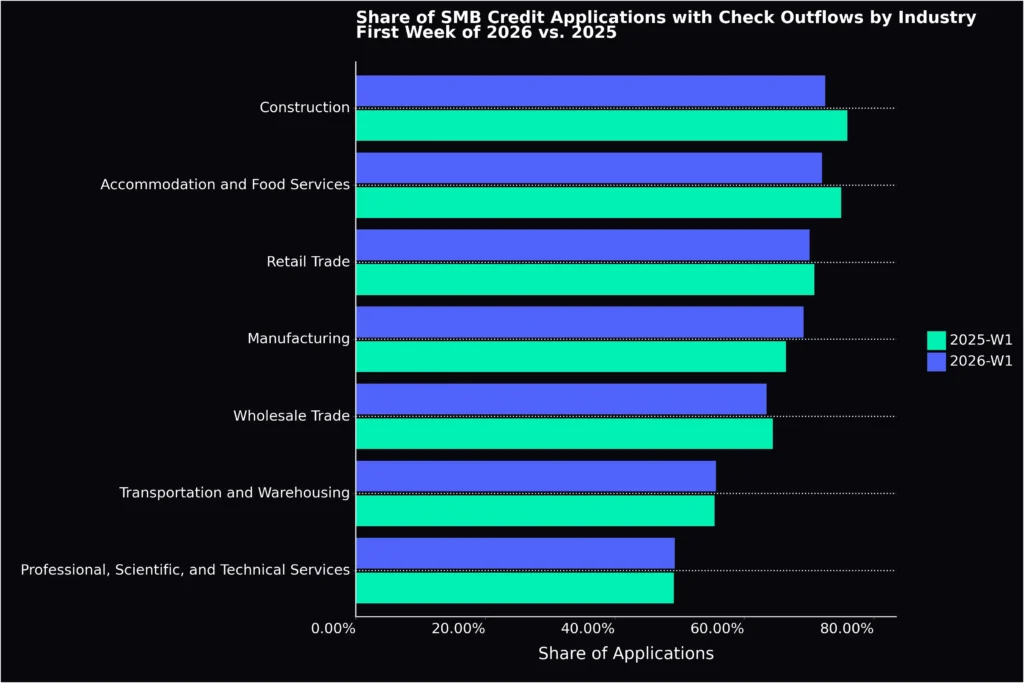
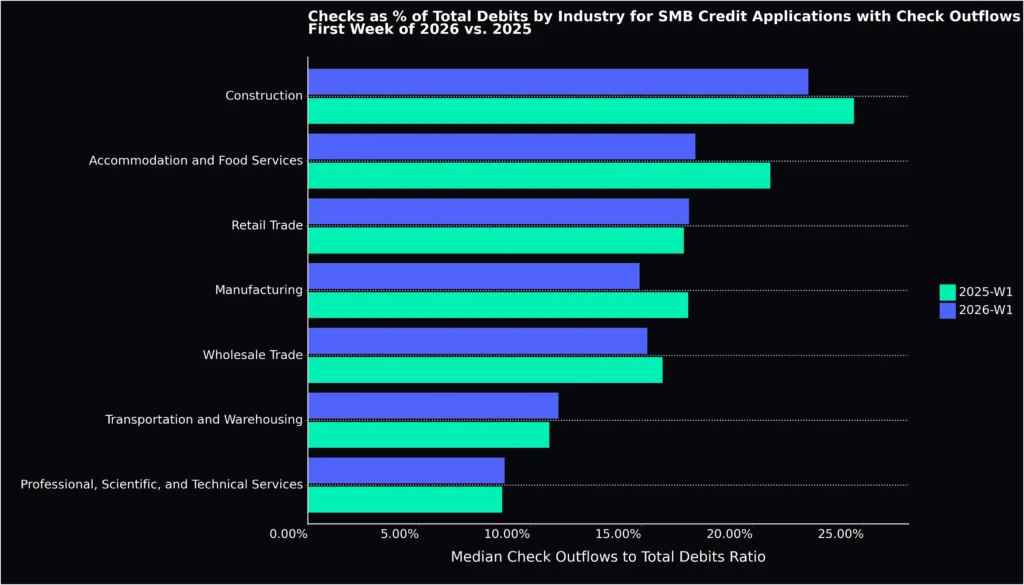
The two charts below mirror those above but focus on check outflows. One clear implication is that a far greater number of businesses use checks to pay bills than accept checks as payments themselves.
Crypto and gambling activity
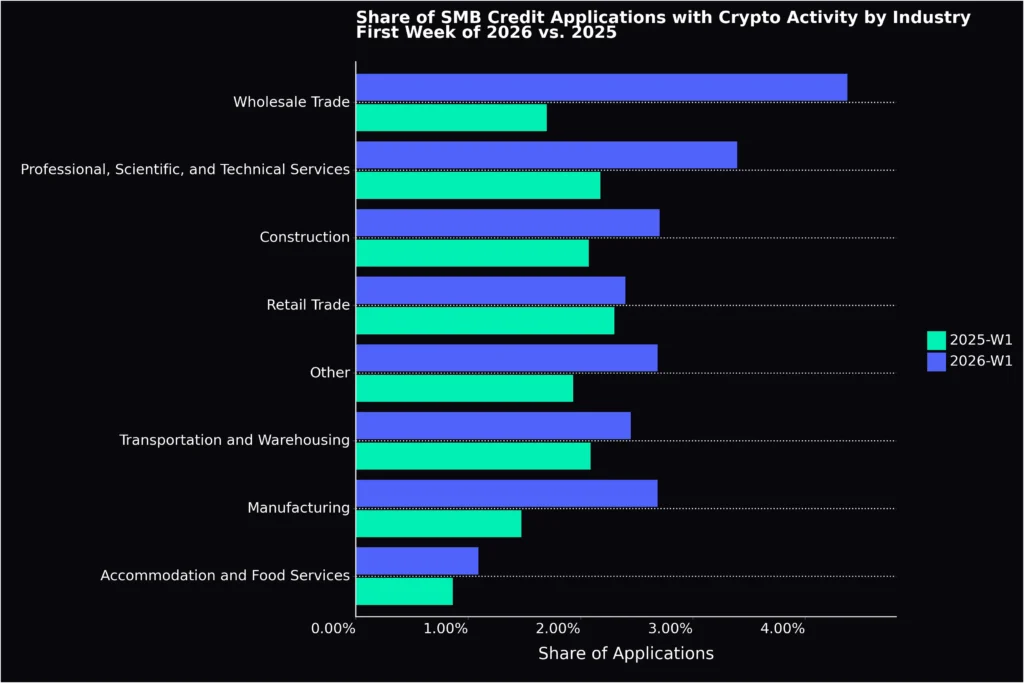
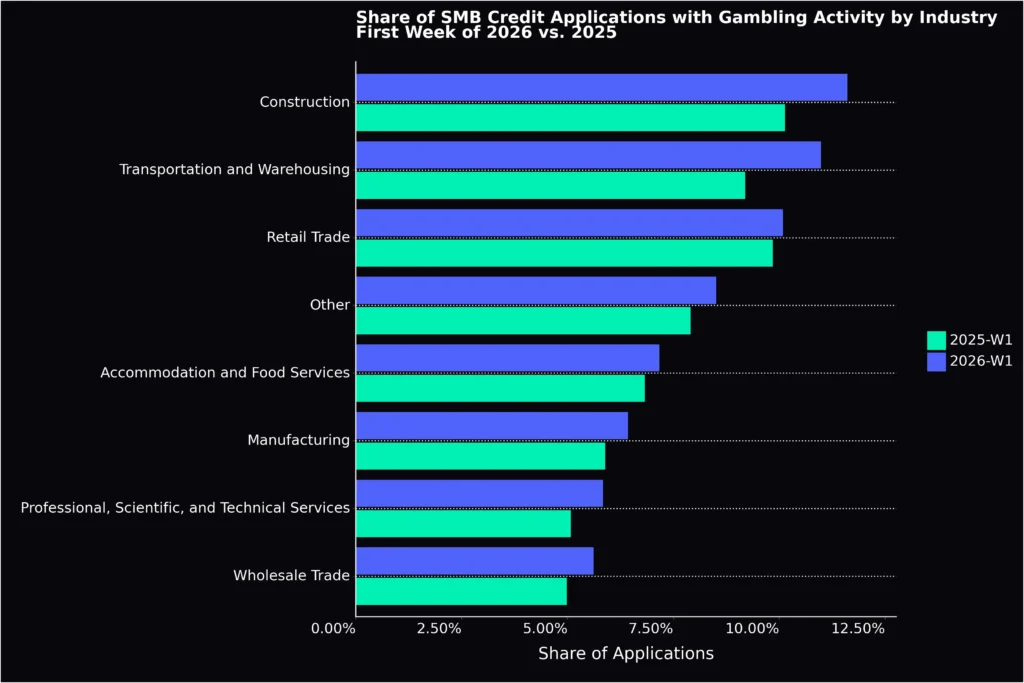
While many people would be surprised to see crypto or gambling on any small business credit application, the prevalence of both behaviors increased markedly across all industries from the first week of 2025 to the first week of 2026. How to consider the risk of these transactions as part of an underwriting process will certainly differ between lenders, but the incidence rate is now too small to ignore, and anyone in the business of credit should pay attention.
Outlook for 2026
SMB cash flow data from the first week of 2026 provides a glimpse into the longer-term trends we’ll watch as the year progresses. In particular:
- SMB credit demand & borrower quality: Application volume in the first five business days of 2026 is ~16% higher than the same period in 2025, signaling a strong appetite for capital. At the same time, credit-seeking behavior has improved: there is a decline in high-intensity shopping and a rise in “clean” applicants with no recent inquiries, suggesting better borrower targeting, improved broker-lender matching, and reduced distress-driven behavior.
- Financial operating profiles & leverage: Core cash-flow metrics, including monthly revenue distributions, payroll-to-revenue ratios, and debt-payment-to-revenue ratios, are remarkably consistent year over year, indicating no broad deterioration in SMB financial health. However, the number of debt counterparties per applicant has increased, pointing to a more complex set of financing relationships.
- Payment behavior modernization: Digital payment usage (Venmo, Zelle, Cash App) has increased across nearly all industries, while check usage continues to decline, with check outflows in certain industries (e.g., construction) as the notable exception. Crypto and gambling transactions have risen meaningfully across industries, moving from edge cases to signals that are now statistically material and increasingly relevant in underwriting.
Whether or not the trends seen in the first five business days persist throughout the year, it’s crystal clear that a precise and detailed analysis of cash flow data is critical to understanding the financial health and debt capacity of small businesses. Analysis of cash flow data with efficiency, accuracy, and unique insight helps lenders drive profitable growth while accelerating the availability of the capital small businesses need to thrive.